With the December 2016 Contrail® software release, OneRain is updating the suite of data analysis tools and data mining engines known as “Contrail Insight” to a new menu location and with a new name: “Contrail Analytics“.
The update affects Contrail Base Station and Contrail Server clients.*
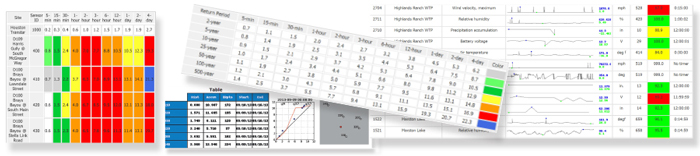
Contrail offers two types of reports: On-Demand and Analytics. Making Contrail Analytics available requires a client-based permission. With this new update, the Analytics reports will live alongside the On-Demand reports making your library of reports easier to find and manage in one location: Administration > Reporting > Reports. More about access and new report features will be available in the online Help documentation coming with this release.
The team here at OneRain is always working to improve our user’s experience by creating better workflow, simplifying processes and adding new features and enhancements. Your feedback on Contrail’s features and usability are incredibly important to us so please let us know what you think.
We frequently release new features, improvements and bug fixes. For the latest information about Contrail software updates and releases, visit the Releases page at https://status.onerain.com
*Contrail Analytics is not available with Contrail Shared Web.
About OneRain Incorporated
Since 1992, OneRain has been providing solutions that optimize water management, heighten regulatory compliance, achieve successful civil works, and save lives. Headquartered in Longmont, Colorado, OneRain’s software and services deliver mission critical information to serve clients responsible for flood early warning, dam safety and reservoir operations, water resources, stormwater and wastewater management. For more information, visit www.onerain.com or call 800-758-RAIN (7246).